核显真能跑大模型?Ling-3.0-tiny 1K→24K 上下文全曲线实测

很多人默认「核显不能跑大模型」,理由是共享显存小、带宽低。我不信这个说法,手头正好有台带 Intel Arc 140T 核显的局域网小主机(235h),23.5 GB 内存,于是把一个 7.9B 的 MoE 模型 Ling-3.0-tiny 砸上去实测了一整轮。

先说结论:核显不但能跑,而且快得超出预期。短上下文 prefill 冲到 556 t/s,比同一台机器的纯 CPU 快 8 倍以上。下面是完整数据。

测试环境

项目值
机器235h / 192.168.31.61
CPUIntel 14C/14T @ 2.0 GHz
内存23.5 GB
GPUIntel Arc 140T (12 GB UMA)
模型Ling-3.0-tiny Q4_K_M · 4.49 GB · bailingmoe3
参数7.89 B total / 1.3 B active
引擎llama.cpp b10621 (Vulkan)

注意这台机器的 CPU 型号被系统抹成了 "Genuine Intel 0000",但 14 核 14 线程、Max 2.0 GHz 是实打实的。核显走 Vulkan 后端,-ngl 99 全量卸载。

第一步:证明核显真的在跑

这一步很重要。llama-bench 输出表格里有一栏写着 backend = Vulkan,但这不能当证据——我实测 -ngl 0(纯 CPU)时那一栏同样写着 Vulkan。必须找硬证据。

证据值
卸载层数25/25 to GPU
Vulkan 权重缓冲4464.69 MiB
CPU 权重缓冲0.00 MiB
KV 缓冲 (q8_0, c=32768)114.75 MiB
GPU 引擎利用率(压测中)116.7%
核显共享内存占用5.76 GB

最直接的对照是关掉 GPU 卸载跑一遍纯 CPU:

prefill 速度(pp512)
iGPU (Vulkan)767.7 t/s
Pure CPU191.3 t/s

核显带来约 4 倍的 prefill 加速。7.9B 的 MoE 权重只有 4.49 GB,正好落在 Arc 140T 共享显存的甜点区。

核心结果:1K→24K 上下文速度曲线

这是最想拿给别人看的一张表。数据取自服务端 print_timing 权威日志,排除了 HTTP 往返开销。

上下文prefillprefill 耗时decode
~880 (1k)556 t/s~1.6 s40.8 t/s
4,096 (4k)332 t/s~12.3 s33.3 t/s
8,192 (8k)178 t/s~46.0 s27.1 t/s
16,384 (16k)88.1 t/s~186 s19.5 t/s
24,576 (24k)58.4 t/s~419 s15.5 t/s
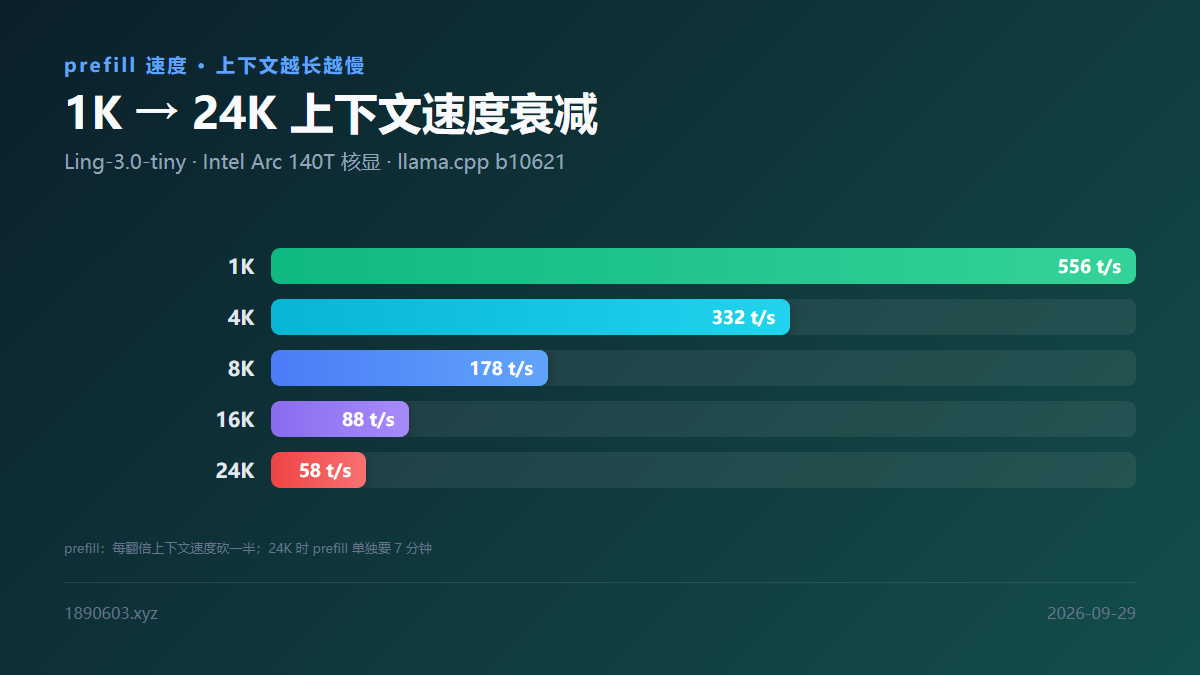
Ling-3.0-tiny 在 Arc 140T 核显上 1K 到 24K 上下文的 prefill 速度衰减图
prefill 随上下文衰减(t/s)
1k556
4k332
8k178
16k88.1
24k58.4
decode 随上下文衰减(t/s)
1k40.8
4k33.3
8k27.1
16k19.5
24k15.5

两条衰减规律

  • prefill 近似减半:556 → 332 → 178 → 88 → 58 t/s,每翻一倍上下文速度砍一半。24k 时光 prefill 就要 7 分钟,这是长上下文最大的时间成本。
  • decode 平缓得多:40.8 → 15.5 t/s,全程只掉 62%。因为 decode 的瓶颈是 batch=1 下从共享内存流式读权重和 kernel launch 开销,长上下文 attention 只占小头。

端到端体感:24K 输入 + 128 输出 ≈ 7.1 分钟,其中 98% 花在 prefill。反过来说,24k→8k 能把 prefill 从 419 秒压到 46 秒(9 倍),而任何参数调整最多给你 6%——长上下文优先减少输入长度,而不是调参。

为什么这个模型长上下文不崩显存

这是 bailingmoe3 架构的关键设计。它是混合线性注意力:24 层里 18 层走 recurrent state(只占 19.27 MiB),只有 6 层是全注意力 KV。

n_head_kv = [0,0,0,1, 0,0,0,1, 0,0,0,1, 0,0,0,1, 0,0,0,1, 0,0,0,1]
                              ↑ 只有 6 层有 KV,其余 18 层是 recurrent state

所以 32k 上下文的 KV 缓存只有 114.75 MiB——f16 也完全放得下,KV 量化在这里根本不是瓶颈。上下文变长对显存的占用极小,prefill 衰减也比纯 Transformer 平缓得多。

参数怎么调:-ub 扫描

我用 8192 token 的真实全量 prefill 扫了 -ub(物理批大小),每点 3 次不同随机前缀取中位数:

-ubmin中位数max
256139.24158.14160.46
512172.47173.14174.42
768175.19177.17180.73
1024180.82183.49192.98
1536185.82187.51193.72
2048178.61183.10190.58
4096179.58181.51187.28
  • 256 → 512 提升最大(+9.5%),这是最小的一块跳板。
  • 收益在 1024~1536 见顶(~187 t/s),再往上(2048/4096)反而略降——内存带宽已经饱和,更大的物理批次只增加 FA 临时内存占用。
  • 推荐 -ub 1536:8k prefill 187.5 t/s,比 768 快 5.8%,且 24k 全量 prefill 未见 OOM。

线程数和 ngl 也有讲究

线程 tpp512tg128
4763.6345.25
6767.5745.58
8767.7345.29
10761.5144.98
12517.1739.14
14645.53 (unstable)38.41

4/6/8/10 基本持平(763~768),但 12/14 明显变差。Vulkan 需要 CPU 线程做提交,线程过订阅反而掉速——这台机器只有 14 核,用 8 线程刚好。

至于 -ngl:这个模型只有 25 层,-ngl 30 就已经全量卸载了,跟 -ngl 99 完全没有差别。25 层模型不需要纠结这个参数。

跟纯 CPU 机器对照

同一台机器的纯 CPU 跑法(-ngl 0)vs 核显,差距比想象中大:

指标纯 CPU核显 Vulkan加速比
pp512191.3 t/s767.7 t/s8.2×
tg12837.7 t/s45.3 t/s2.4×

8 条踩坑记录

1. 别用 llama-bench 的 pp512 代表真实长输入

pp512 跑出 768 t/s,但 8k 真实输入只有 178 t/s,差 4 倍多。prefill 吞吐随长度急剧衰减,基准对比必须用相同长度的实测。

2. 测速必须先确认只有一个客户端

-np 1 单 slot 下并发请求是串行排队的。我曾因一个输出被缓冲的"假死"客户端导致误判——同一个 16k 目标从 6 次变成 12 次,总耗时翻倍。

3. Vulkan 服务不能用 SYSTEM 身份跑

以 SYSTEM 在 session 0 跑时 -c 32768 -ctk f16 直接挂死:进程在、端口 listen、但 /health 无响应。改用登录会话(-LogonType Interactive)后一切正常——GPU 上下文需要交互式会话。

4. PowerShell 5.1 读无 BOM 的 UTF-8 脚本会崩

文件里有中文就按 GBK 读,把字符串截断成非法 token → ParserError,脚本一行都不执行。表现极具迷惑性:日志文件 0 字节、stdout 无任何报错。解决办法:测试逻辑全放 Python 3(原生 UTF-8),.ps1 只做纯 ASCII 启动器。

5. Start-Process 起的子进程会随 SSH 断开被杀

即使加了 -RedirectStandardOutput 也不行。解决办法:把 llama-server.exe 注册成计划任务(-LogonType Interactive),用 Start-ScheduledTask 拉起。任务本身就是服务进程,SSH 断开无影响,6~12 秒就绪。

6. 含空格的路径会让 Start-Process 静默失败

-ArgumentList 不会给含空格的路径加引号。我的模型路径 ...\Default Project\... 就中招了:服务静默启动失败、日志 0 字节。解决办法:用计划任务的 -Argument 字符串手工拼引号。

7. scp 传带空格的路径报 ambiguous target

Windows OpenSSH 的 scp 会报 ambiguous target。解决办法:先传到无空格的 C:\temp\,再远程 Move-Item 到模型目录。

8. 测速前记得破前缀缓存

连续 3 次相同的 8k prompt 会全部命中缓存,测出来 prompt eval time ≈ 1 token/~1s,完全是假的。我的做法:prompt 最前面加 64 位随机前缀破坏公共前缀,并在请求体里显式带 "cache_prompt": false。

最终推荐参数

llama-server.exe -m "C:\path\Ling-3.0-tiny-Q4_K_M.gguf" \
  -ngl 99 -t 8 -ctk q8_0 -ctv q8_0 -fa on \
  -ub 1536 -b 2048 -c 32768 \
  --host 0.0.0.0 --port 8088 -np 1 -lv 3 --no-warmup
  • 日常用这套:8k prefill 从 177 提到 187.5 t/s(+5.8%),24k 未见 OOM。
  • 长上下文优先减输入长度,而不是调参。24k→8k 能省 9 倍时间,任何 -ub 调整最多 6%。
  • 短上下文(≤8k)体验最好:8k 输入 + 128 输出 ≈ 51 秒,decode 27 t/s 属于可交互范围。
  • KV 量化不是瓶颈:32k 上下文仅 114.75 MiB,追求无损可以用 -ctk f16 -ctv f16,显存依然充裕。
适合什么场景这个模型适合当「长上下文速读」角色——24k 输入 7 分钟换 128 token 输出,适合离线批量摘要/审阅类任务;不适合低延迟场景。短上下文优先,体验反而最好。
数据说明以上全部为本机实测(235h / Arc 140T / Windows 11 LTSC / llama.cpp b10621),不同驱动与配置下会有浮动,仅供参考。想自己复现可以看 llama-server 服务化 和 核显共享显存调优。

Most people assume an iGPU "can't run an LLM" because of the tiny shared VRAM and limited bandwidth. I had a LAN box with an Intel Arc 140T sitting around, so I threw a 7.9B MoE model — Ling-3.0-tiny — at it and measured everything.

Short version: the iGPU handles it, and faster than you'd expect. Short-context prefill hits 556 t/s — over 8x the same machine on pure CPU. Full data below.

Test environment

ItemValue
Machine235h / 192.168.31.61
CPUIntel 14C/14T @ 2.0 GHz
RAM23.5 GB
GPUIntel Arc 140T (12 GB UMA)
ModelLing-3.0-tiny Q4_K_M · 4.49 GB · bailingmoe3
Parameters7.89 B total / 1.3 B active
Enginellama.cpp b10621 (Vulkan)

The CPU name is masked as "Genuine Intel 0000" by the system, but 14C/14T at 2.0 GHz is real. The iGPU runs through the Vulkan backend with -ngl 99 for full offload.

Step 1: Proving the iGPU is actually working

This matters. The llama-bench table has a backend = Vulkan column — but that's not evidence. I confirmed it also says Vulkan with -ngl 0 (pure CPU). You need hard proof.

EvidenceValue
Offloaded layers25/25 to GPU
Vulkan model buffer4464.69 MiB
CPU model buffer0.00 MiB
KV buffer (q8_0, c=32768)114.75 MiB
GPU engine util (under load)116.7%
iGPU shared memory5.76 GB

The cleanest cross-check is to turn off GPU offload and run pure CPU:

Prefill (pp512)
iGPU (Vulkan)767.7 t/s
Pure CPU191.3 t/s

The iGPU delivers roughly 4x the prefill speed. At just 4.49 GB, the MoE weights land right in the Arc 140T's shared-VRAM sweet spot.

Main result: 1K to 24K context speed curves

This is the table I most wanted to produce. Numbers come from the server-side print_timing log, which excludes HTTP round-trip overhead.

ContextPrefillPrefill timeDecode
~880 (1k)556 t/s~1.6 s40.8 t/s
4,096 (4k)332 t/s~12.3 s33.3 t/s
8,192 (8k)178 t/s~46.0 s27.1 t/s
16,384 (16k)88.1 t/s~186 s19.5 t/s
24,576 (24k)58.4 t/s~419 s15.5 t/s
Prefill decay from 1K to 24K context for Ling-3.0-tiny on Arc 140T iGPU
Prefill decay by context (t/s)
1k556
4k332
8k178
16k88.1
24k58.4
Decode decay by context (t/s)
1k40.8
4k33.3
8k27.1
16k19.5
24k15.5

Two decay laws

  • Prefill roughly halves: 556 → 332 → 178 → 88 → 58 t/s. At 24k, prefill alone takes 7 minutes — that's the dominant cost of long context.
  • Decode decays far more gently: 40.8 → 15.5 t/s, only a 62% drop. Decode is bottlenecked on streaming weights from shared memory and kernel launch overhead, not attention.

End to end: 24K input + 128 output ≈ 7.1 minutes, 98% of it prefill. Cutting 24k to 8k drops prefill from 419s to 46s (9x) while any parameter tweak buys at most 6%. For long context, shorten the input — don't tune flags.

Why this model doesn't blow up VRAM at long context

This is the key design of the bailingmoe3 architecture. It's hybrid linear attention: 18 of 24 layers use a recurrent state (only 19.27 MiB), and just 6 layers carry full-attention KV.

n_head_kv = [0,0,0,1, 0,0,0,1, 0,0,0,1, 0,0,0,1, 0,0,0,1, 0,0,0,1]
                              ↑ 只有 6 层有 KV,其余 18 层是 recurrent state

So KV cache at 32k context is only 114.75 MiB — f16 fits easily and KV quantization is pointless here. Memory barely grows with context, and prefill decays far more gently than a pure Transformer.

Tuning: the -ub sweep

I swept -ub (physical batch size) with real 8192-token full prefills, 3 random prefixes per point, median taken:

-ubminmedianmax
256139.24158.14160.46
512172.47173.14174.42
768175.19177.17180.73
1024180.82183.49192.98
1536185.82187.51193.72
2048178.61183.10190.58
4096179.58181.51187.28
  • 256 → 512 is the biggest jump (+9.5%) — that's the cheapest win.
  • Returns peak at 1024–1536 (~187 t/s); going larger (2048/4096) slightly regresses — memory bandwidth is saturated and bigger physical batches only add FA scratch memory.
  • Use -ub 1536: 8k prefill at 187.5 t/s, 5.8% faster than 768, and no OOM at 24k full prefill.

Thread count and ngl

threads tpp512tg128
4763.6345.25
6767.5745.58
8767.7345.29
10761.5144.98
12517.1739.14
14645.53 (unstable)38.41

4/6/8/10 are all within noise (763–768), but 12/14 clearly regress. Vulkan needs CPU threads for submission and over-subscription hurts. With 14 cores, 8 threads is the sweet spot.

As for -ngl: with only 25 layers, -ngl 30 already offloads everything — identical to -ngl 99. Small models make this parameter irrelevant.

Against a pure-CPU machine

Pure CPU (-ngl 0) vs the iGPU on the same box — the gap is larger than you'd guess:

MetricPure CPUiGPU VulkanSpeedup
pp512191.3 t/s767.7 t/s8.2×
tg12837.7 t/s45.3 t/s2.4×

8 pitfalls I hit

1. pp512 does not represent real long-input prefill

pp512 reports 768 t/s, but real 8k input gives 178 t/s — over 4x apart. Prefill throughput collapses with length; always compare benchmarks at the same length.

2. Confirm you have exactly one client

With -np 1, concurrent requests just queue. I misread results once because a buffer-blocked "hung" client doubled the sample count for the same 16k target.

3. Don't run the Vulkan service as SYSTEM

As SYSTEM in session 0, -c 32768 -ctk f16 just hangs: process alive, port listening, but /health never responds. Running in an interactive logon session fixes it — GPU contexts need an interactive session.

4. PowerShell 5.1 dies on BOM-less UTF-8 scripts

Any Chinese in a BOM-less file gets read as GBK, producing invalid tokens and a ParserError where not one line executes. The symptom is deceptive: zero-byte log file, no error on stdout. Fix: put test logic in Python 3 and keep .ps1 as an ASCII-only launcher.

5. Start-Process children die when SSH disconnects

Even with -RedirectStandardOutput. Fix: register llama-server.exe as a scheduled task and launch it with Start-ScheduledTask. The task is the process, so SSH disconnects don't touch it; it's ready in 6–12s.

6. Paths with spaces break Start-Process

-ArgumentList doesn't quote paths with spaces. My model path ...\Default Project\... hit this exactly: silent startup failure, zero-byte log. Fix: hand-quote in the scheduled task's -Argument string.

7. scp chokes on spaces in the path

Windows OpenSSH scp reports ambiguous target. Fix: copy to a space-free C:\temp\ first, then Move-Item remotely.

8. Break the prefix cache before measuring

Three identical 8k prompts in a row all hit cache, producing a fake prompt eval time ≈ 1 token/~1s. My fix: prepend a 64-char random prefix to break the shared prefix, and explicitly pass "cache_prompt": false.

Recommended flags

llama-server.exe -m "C:\path\Ling-3.0-tiny-Q4_K_M.gguf" \
  -ngl 99 -t 8 -ctk q8_0 -ctv q8_0 -fa on \
  -ub 1536 -b 2048 -c 32768 \
  --host 0.0.0.0 --port 8088 -np 1 -lv 3 --no-warmup
  • Use this daily: 8k prefill goes from 177 to 187.5 t/s (+5.8%), no OOM at 24k.
  • Shorten the input for long context rather than tuning flags. 24k→8k saves 9x; any -ub change buys at most 6%.
  • Short context (≤8k) feels best: 8k in + 128 out ≈ 51s, with decode at 27 t/s — comfortably interactive.
  • KV quantization isn't the bottleneck: 114.75 MiB at 32k means -ctk f16 -ctv f16 is fine if you want lossless.
Where this fitsThis model suits a long-context skim reader role: 7 minutes for 24k in, 128 tokens out. Great for offline batch summarization or review, wrong for low latency.
Data noteEverything above is measured on my own box (235h / Arc 140T / Windows 11 LTSC / llama.cpp b10621); numbers vary by driver and config. See llama-server serving and iGPU shared VRAM tuning to reproduce.
返回文章列表