CPU 跑分查询工具界面

逛装机群的时候经常看到这样的对话:"i5-13600K 和 Ryzen 7 5700X3D 哪个好?""我看跑分差不多啊,为啥价格差几百?"问题就出在"看跑分"这三个字上——跑分不看口径,等于白看。这篇把 PassMark 跑分的正确打开方式讲清楚。

两个分数,两种用途

PassMark 给每颗 CPU 两个核心分数,弄混它们是 90% 误读的来源:

分数测的是什么对应什么体验
综合分(CPUMark)满载多线程性能渲染、编译、压缩、多开虚拟机
单线程分(Single Thread)单核爆发性能游戏帧率、日常响应、网页、 office

举个例子:线程撕裂者 7980X 综合分 18 万+,是 i9-14900K 的三倍,但打游戏未必更强——因为游戏大多吃单线程和缓存,不吃 64 个线程。反过来,帮朋友渲染视频,综合分才是硬道理。

一个粗略的换算:单线程分 ≈ 你这台机器"日常跟手程度"的上限;综合分 ÷ 价格 ≈ 生产力的性价比

跑分和实际体验的换算关系

跑分是相对数,不是体验承诺。几个实用参考:

  • 单线程分差 10% 以内:日常使用基本无感,别为这个升级
  • 游戏帧率:1080p 高刷场景单线程分最重要;4K 下更多看显卡,CPU 差距被抹平
  • 编译 / 渲染:时间几乎和综合分成反比,2 万分比 1 万分快一倍左右
  • 老平台升级:先看单线程提升幅度,综合分提升大不代表日常更快

还有个容易被忽略的点:跑分是持续满载。笔记本 CPU 跑分高不代表实际强——散热压不住,分数再高也会降频。看笔记本跑分要配合功耗释放一起看。

动手查:免费的天梯查询工具

我把自己整理的 6715 款 CPU 数据做成了 CPU 跑分查询工具,搜型号、按品牌/平台/功耗筛选、选 2~4 款直接出对比图,还能找"性能相近"的替代型号:
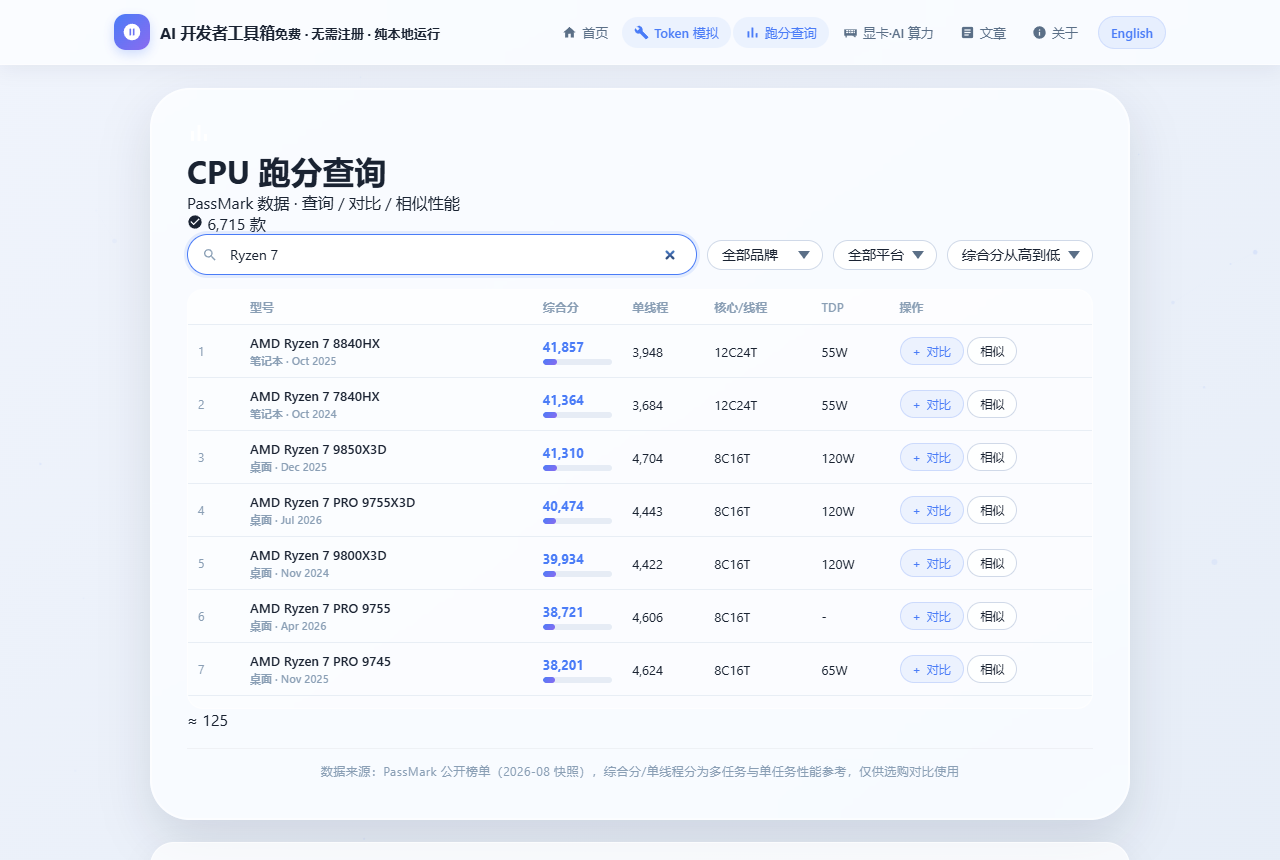
CPU 跑分查询:搜索、对比与相似性能匹配
搜索型号 → 加入对比 → 查看综合分/单线程对比与规格卡

数据来自 PassMark 公开榜单(2026 年 8 月快照),含桌面、笔记本、服务器全平台。所有查询都在浏览器本地完成。

三个真实场景演练

  • 场景一:纯打游戏。打开工具按"单线程"排序,在你的预算段里选单线程分最高的,再看主板生态和二手价格。5700X3D 这类大缓存型号单线程分不冒尖但游戏很强——记得结合评测看缓存。
  • 场景二:迷你主机 / 软路由。按平台筛"笔记本",再按 TDP 从低到高排,在 15~35W 里挑综合分最高的——这就是同功耗下性能最强的选择。
  • 场景三:买二手捡漏。查一下目标型号的"相似性能",往往会发现服务器退役卡(Xeon)性价比惊人,但要注意主板和功耗的坑。

小结

记住一句话:综合分给生产力看,单线程分给日常体验看,笔记本再看功耗释放。跑分不是全部,但是最公平的起点——至少它不会骗你。数据快照会持续更新,选型时欢迎用工具复查最新排名。

免责声明:跑分数据来自 PassMark 公开榜单(2026-08 快照),反映统计样本的平均值,实际表现受平台配置、散热、软件优化影响。

Forum threads constantly ask "is the i5-13600K better than the Ryzen 7 5700X3D? The benchmark scores look similar but the prices differ." The confusion comes from reading benchmarks without understanding what they measure. Here's the practical way to read PassMark numbers.

Two scores, two purposes

ScoreWhat it measuresMaps to
CPUMark (multi)Full-load multi-threaded throughputRendering, compiling, VMs, compression
Single-thread ratingSingle-core burst performanceGame fps, everyday snappiness, office apps

A Threadripper 7980X scores 3× an i9-14900K in CPUMark but isn't 3× faster in games — most games lean on single-thread and cache, not 64 threads. Conversely, for video rendering the multi-core score is king. Rule of thumb: single-thread ≈ daily responsiveness; CPUMark ÷ price ≈ productivity value.

From scores to experience

  • <10% single-thread gap: imperceptible daily — not worth an upgrade
  • Gaming: single-thread rules at 1080p high-refresh; at 4K the GPU bottlenecks and CPU gaps shrink
  • Compile/render: time scales roughly inverse to CPUMark — 20K is about 2× faster than 10K
  • Laptops: benchmarks assume sustained load; check the actual power limit (PL1/PL2), not just the model name

Try it yourself

I compiled 6,715 CPUs into a free Benchmark Search tool — search by name, filter by brand/platform/TDP, compare 2–4 models side by side, and find similar-performance alternatives. Data comes from public PassMark rankings (August 2026 snapshot); everything runs locally in your browser.

Three real scenarios

  • Pure gaming: sort by single-thread in your budget; remember big-cache parts like the 5700X3D punch above their score in games
  • Mini PC / router: filter platform = laptop, sort by TDP low→high, pick the highest CPUMark within your thermal budget
  • Used-market hunting: check "similar performance" for a target — retired Xeons often look great, but mind motherboard and power quirks

Wrap-up

One sentence to remember: multi-core score for productivity, single-thread for daily feel, plus power limits for laptops. Benchmarks aren't everything, but they're the fairest starting point — and they don't lie.

Disclaimer: data from public PassMark rankings (Aug 2026 snapshot); real-world results vary with platform, cooling and software.
返回文章列表